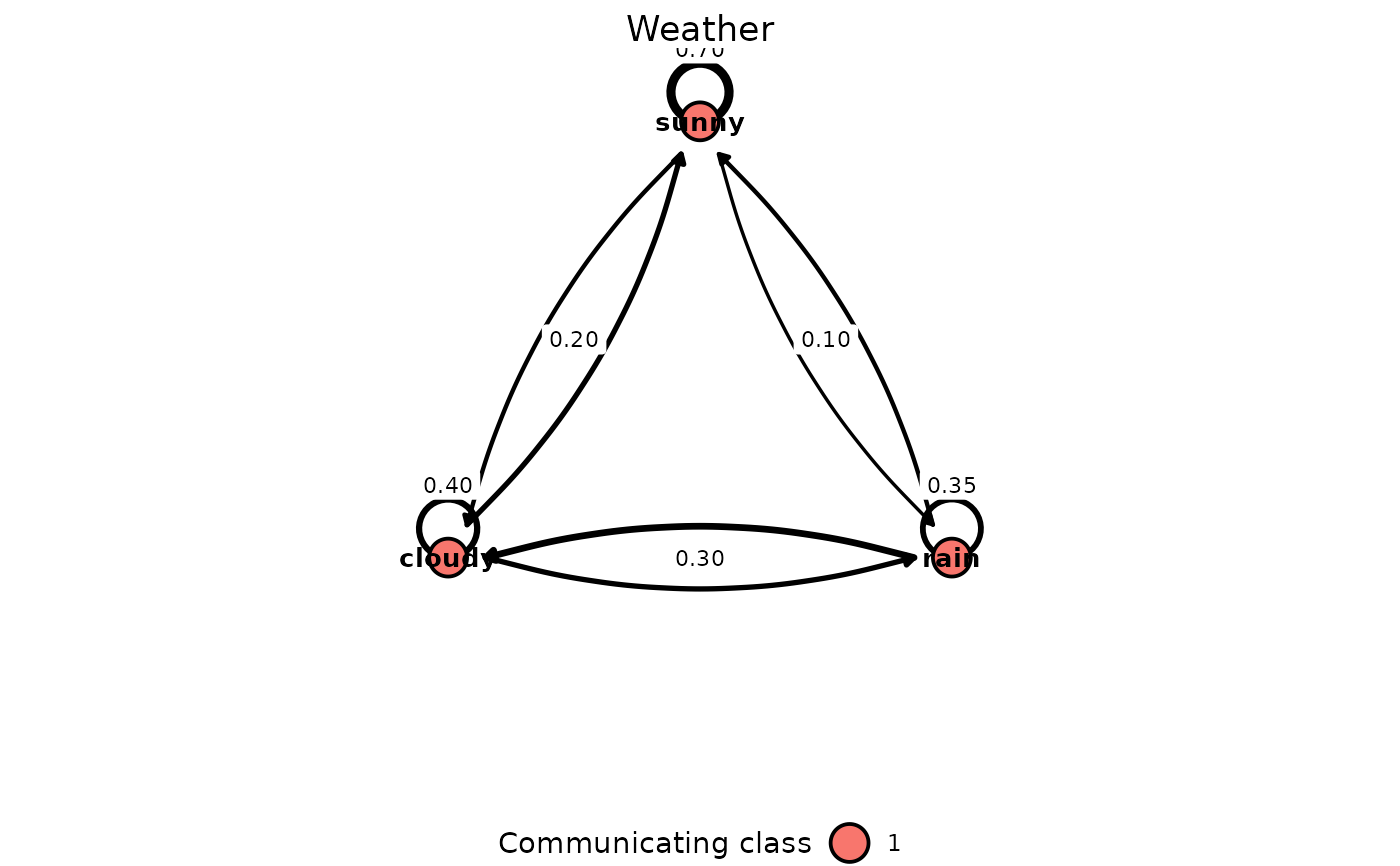
Creates a ggplot2 representation of a discrete-time Markov chain. Nodes are states and directed edges represent transitions with positive probability. Communicating classes are shown with different node fills.
Arguments
- object
An object of class `markovchain`.
- threshold
Minimum transition probability to display. Defaults to 0.
- show_probabilities
Logical; whether to label edges with transition probabilities. Defaults to `TRUE`.
- digits
Number of digits used to format transition probabilities.
- node_size
Size of state nodes in the ggplot2 plot.
- edge_width
Minimum width multiplier for transition edges.
- type
Type of plot:
"graph"(default) draws the transition graph;"eigenvalues"draws the eigenvalues of the transition matrix in the complex plane together with the unit circle;"flow"draws the evolution of the distribution over the states, as computed byredistribute;"comparison"comparesobjectwith the chains inother.- steps
Number of steps of the
"flow"plot. Defaults to 20. Ignored for the other types.- initial
Initial distribution of the
"flow"plot, seeredistribute. Defaults to the uniform distribution. Ignored for the other types.- other
For
type = "comparison": amarkovchainobject or a (possibly named) list of them, to be compared withobject. All chains must be defined on the same set of states, which are matched by name, so their order may differ. Ignored for the other types.- what
For
type = "comparison":"transition"(default) draws the transition matrices side by side as heatmaps on a common probability scale;"stationary"compares the stationary distributions as grouped bars (every chain must then be irreducible). Ignored for the other types.- ...
Currently unused, reserved for future extensions.
Examples
if (requireNamespace("ggplot2", quietly = TRUE)) {
  weather <- matrix(c(0.7, 0.2, 0.1,
                      0.3, 0.4, 0.3,
                      0.2, 0.45, 0.35),
                    nrow = 3, byrow = TRUE,
                    dimnames = list(c("sunny", "cloudy", "rain"),
                                    c("sunny", "cloudy", "rain")))
  mc <- new("markovchain", states = rownames(weather),
            transitionMatrix = weather, name = "Weather")
  ggplot2::autoplot(mc)
  ggplot2::autoplot(mc, type = "eigenvalues")
  ggplot2::autoplot(mc, type = "flow", steps = 10, initial = "rain")

  # compare with a "stickier" version of the same chain
  sticky <- lazyChain(mc, alpha = 0.5)
  sticky@name <- "Lazy weather"
  ggplot2::autoplot(mc, type = "comparison", other = sticky)
  ggplot2::autoplot(mc, type = "comparison", other = sticky,
                    what = "stationary")
}